I've been working on an app that provides a user-friendly interface to Linear Programming solvers, specifically for resource allocation problems. I have a UI that works, and it is getting data into the solver, however I don't think I'm setting up my solver correctly yet :0
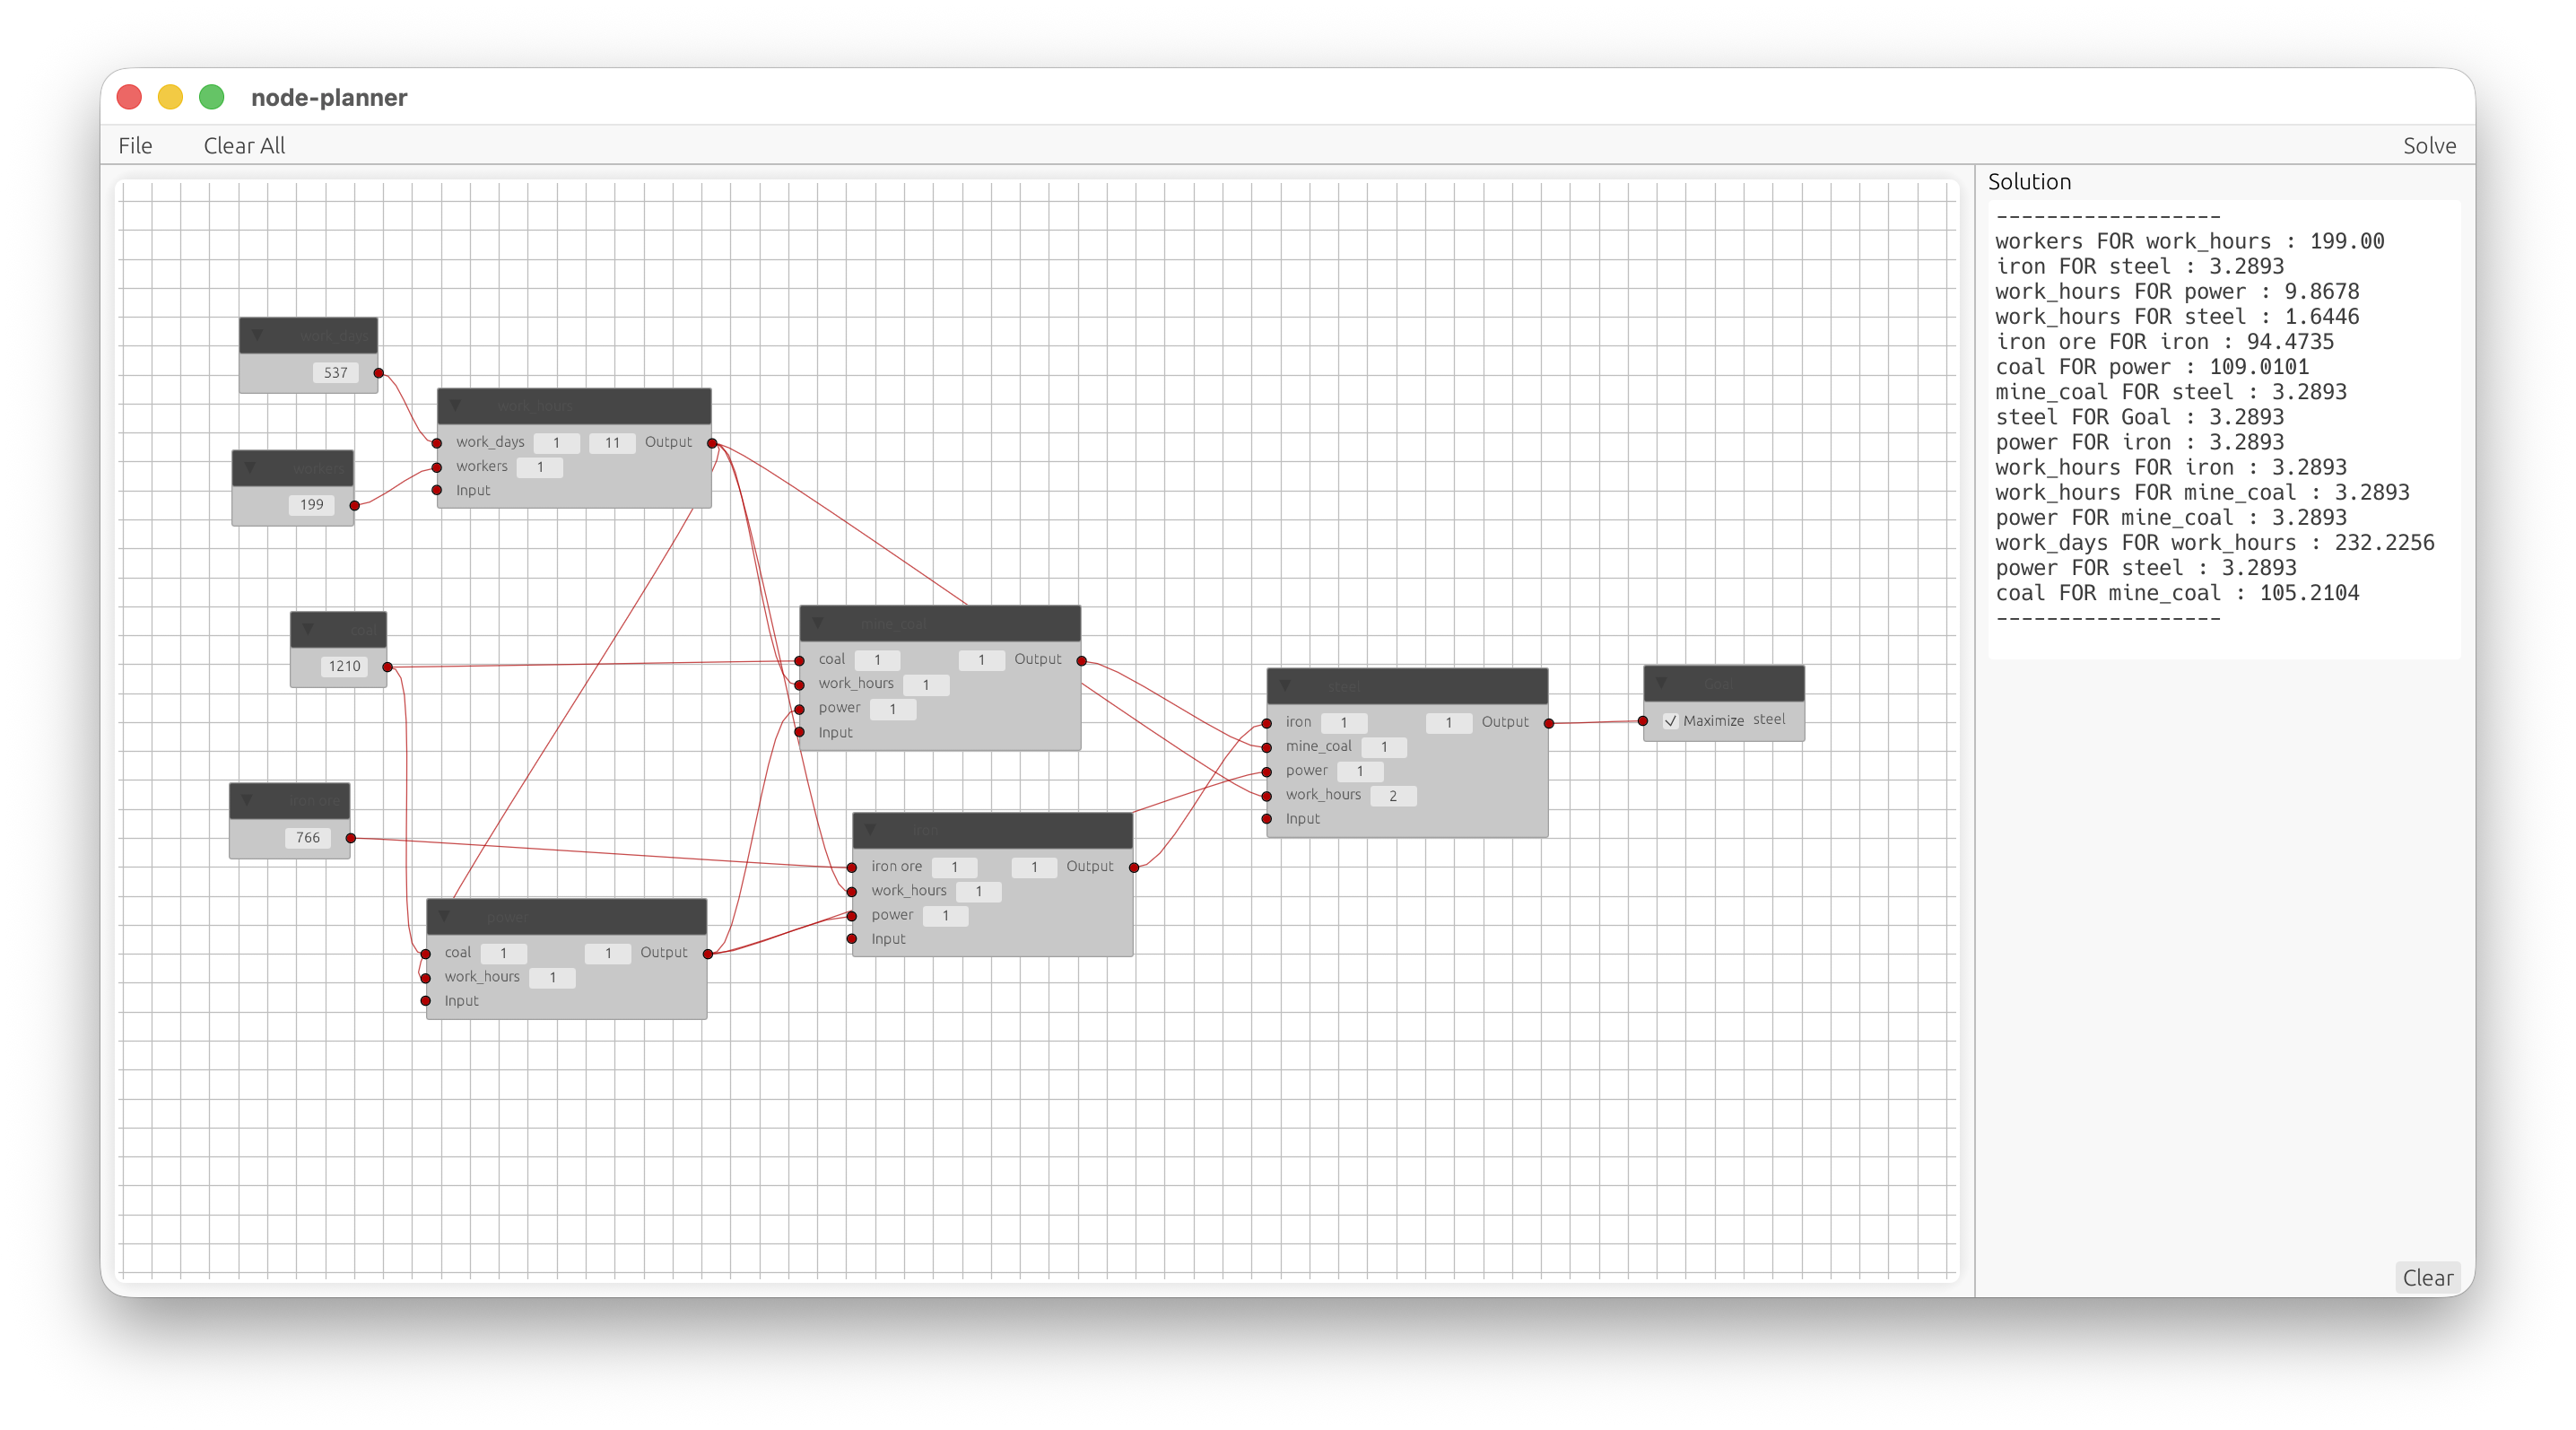
Ooh, I'd love to see a visualization of that output. Especially if it's not correct (232 work_days for work_hours?), it could be very funny.
I worked on a bespoke IDE for hierarchical planning, which produced a timeline. This output looks like a network with weighted edges; time doesn't matter, but proportions do? Maybe there's some additional context, like the size of each bin of resource, which I can kind-of make out from the input graph. Sweet work!
This is all-at-once, more allocation than planning! Basically the variables I'm displaying here are the amount of any given resource consumed to create any other given resource. I have a better solver system now though, and it works kind of similar.
Can you expand on what you think makes this UI "user friendly"?
And maybe what is "planned but not yet present on screenshot", if it is incomplete.
For decades I considered nodes+wires to be "better" than tables or plain text/code, but recently, every time I try to defend that thought – I can't.
To be fair this looks more like a prototype than a polished embodiment. Besides the obvious (better labels), one way to make the UI user friendly would be to put the solution details near the relevant boxes.
One fair critique of nodes+wires is a tendency to get tangled. Even in this little example, I count roughly a dozen crossings in roughly that many edges.