Christopher Shank 2024-11-25 01:28:16 "make illegal states unconnectable"
Alex McLean 2024-11-25 11:10:40 howabout making proximal nodes connect automatically, where legal?
Christopher Shank 2024-11-25 19:34:20 Im still fleshing out some proximity-based primitives, so that might be possible to explore soon!
Alex McLean 2024-11-26 10:45:44 In these examples you just don't have to draw the wire at all, things connect/disconnect automatically according to proximity and type compatibility
Oleksandr Kryvonos 2024-11-25 14:03:18 I am back with small project ( ~work in progress~ already finalized),
Have you ever thought that git diff does not really show the history of changes you made and just shows the final state,
this can be solved with more granual commits,
so my project - github.com/uprun/git-auto-commit - creates commits when file changes,
in such way ~changes will be sent real-time and~ the transformation history is saved as well.
Ivan Reese 2024-11-25 16:44:23 These are interesting projects! Having more history to explore (eg: commit on save, or even commit on keystroke) feels likely to offer a bunch of benefits… if we can crack the UI challenges it brings.
I like how you handle this, Kartik, by focusing on the "when I have something to say" communication part of creating a commit. Like, with git, I usually think of the snapshot of the codebase as the thing I'm capturing, and the commit message is just a summary of what's changed since the last snapshot. But by making it log-first, it's the train of thought that's being captured, and the snapshot of the code is just the context needed for each thought. I love this inversion.
Oleksandr — how do commit messages work in your project? Any thoughts on what you might do there?
For Patchwork, Geoffrey Litt and Paul Sonnentag did some interesting things that are relevant here. For one, they did a commit-per-keystroke, but then used some smart heuristics to batch together these changes into meaningful units of work. Another great thing they found is that using AI generated commit messages is pretty good, actually. Though I think I like Kartik's approach even more.
Oleksandr Kryvonos 2024-11-25 21:39:32
Oleksandr — how do commit messages work in your project? Any thoughts on what you might do there?
Ivan Reese I put just time-stamp there, but I have another approach:
- I always start develpment from "main" branch into a feature branch
- inside feature branch commits do not have any meaningful text except for the time of change;
- when I merge back the feature branch I summarize what changes I made
Oleksandr Kryvonos 2024-11-25 21:50:29
I don't quite follow "transformation history,"
Oleksandr Kryvonos
Kartik Agaram I will explain - in my workflow what I do with code usuallly is:
- I extract block of code into a function
- I replace piece of expression with a meaningful variable name (similar to step 1)
- I add condition around block of code
- I write a function from scratch
- I copy and paste existing function and modify it for the new case.
After each of these steps I often save the file to check whether it still works. This is what I call transormation history.
List of actions above is not finalized of course.
Oleksandr Kryvonos 2024-11-25 23:25:46 and now I finalized the project, seems like it already covers all the cases I wanted and I only spent 3 days on it. I will use it now in all of my personal projects. I shall see what is missing.
Konrad Hinsen 2024-11-27 11:10:10 Over the last weeks I have been working on my moldable inspector for Common Lisp again, with the goal of turning it into a support platform for explainable data science. One big task that I have finally achieved is code browsing. You can navigate through the code by clicking on symbols in displayed code. And you can transclude code into HTML, as shown on the first pane.
This wasn't trivial to do because Common Lisp cannot be statically parsed. When loading code, Lisp reads one top-level form (everything between a top-level pair of parentheses), executes it, and then goes on to the next one. The semantics of each form thus depend on the previous ones. Static parsing, as I do here, can never be perfect. The goal is getting the parser to deal with 99% of code correctly and not crash on the remaining 1%.
Fortunately, others had done most of the hard work, and I could use Eclector, a portable and extensible Common Lisp reader, as the basis for my code browser.
The code for my demo available on Codeberg.
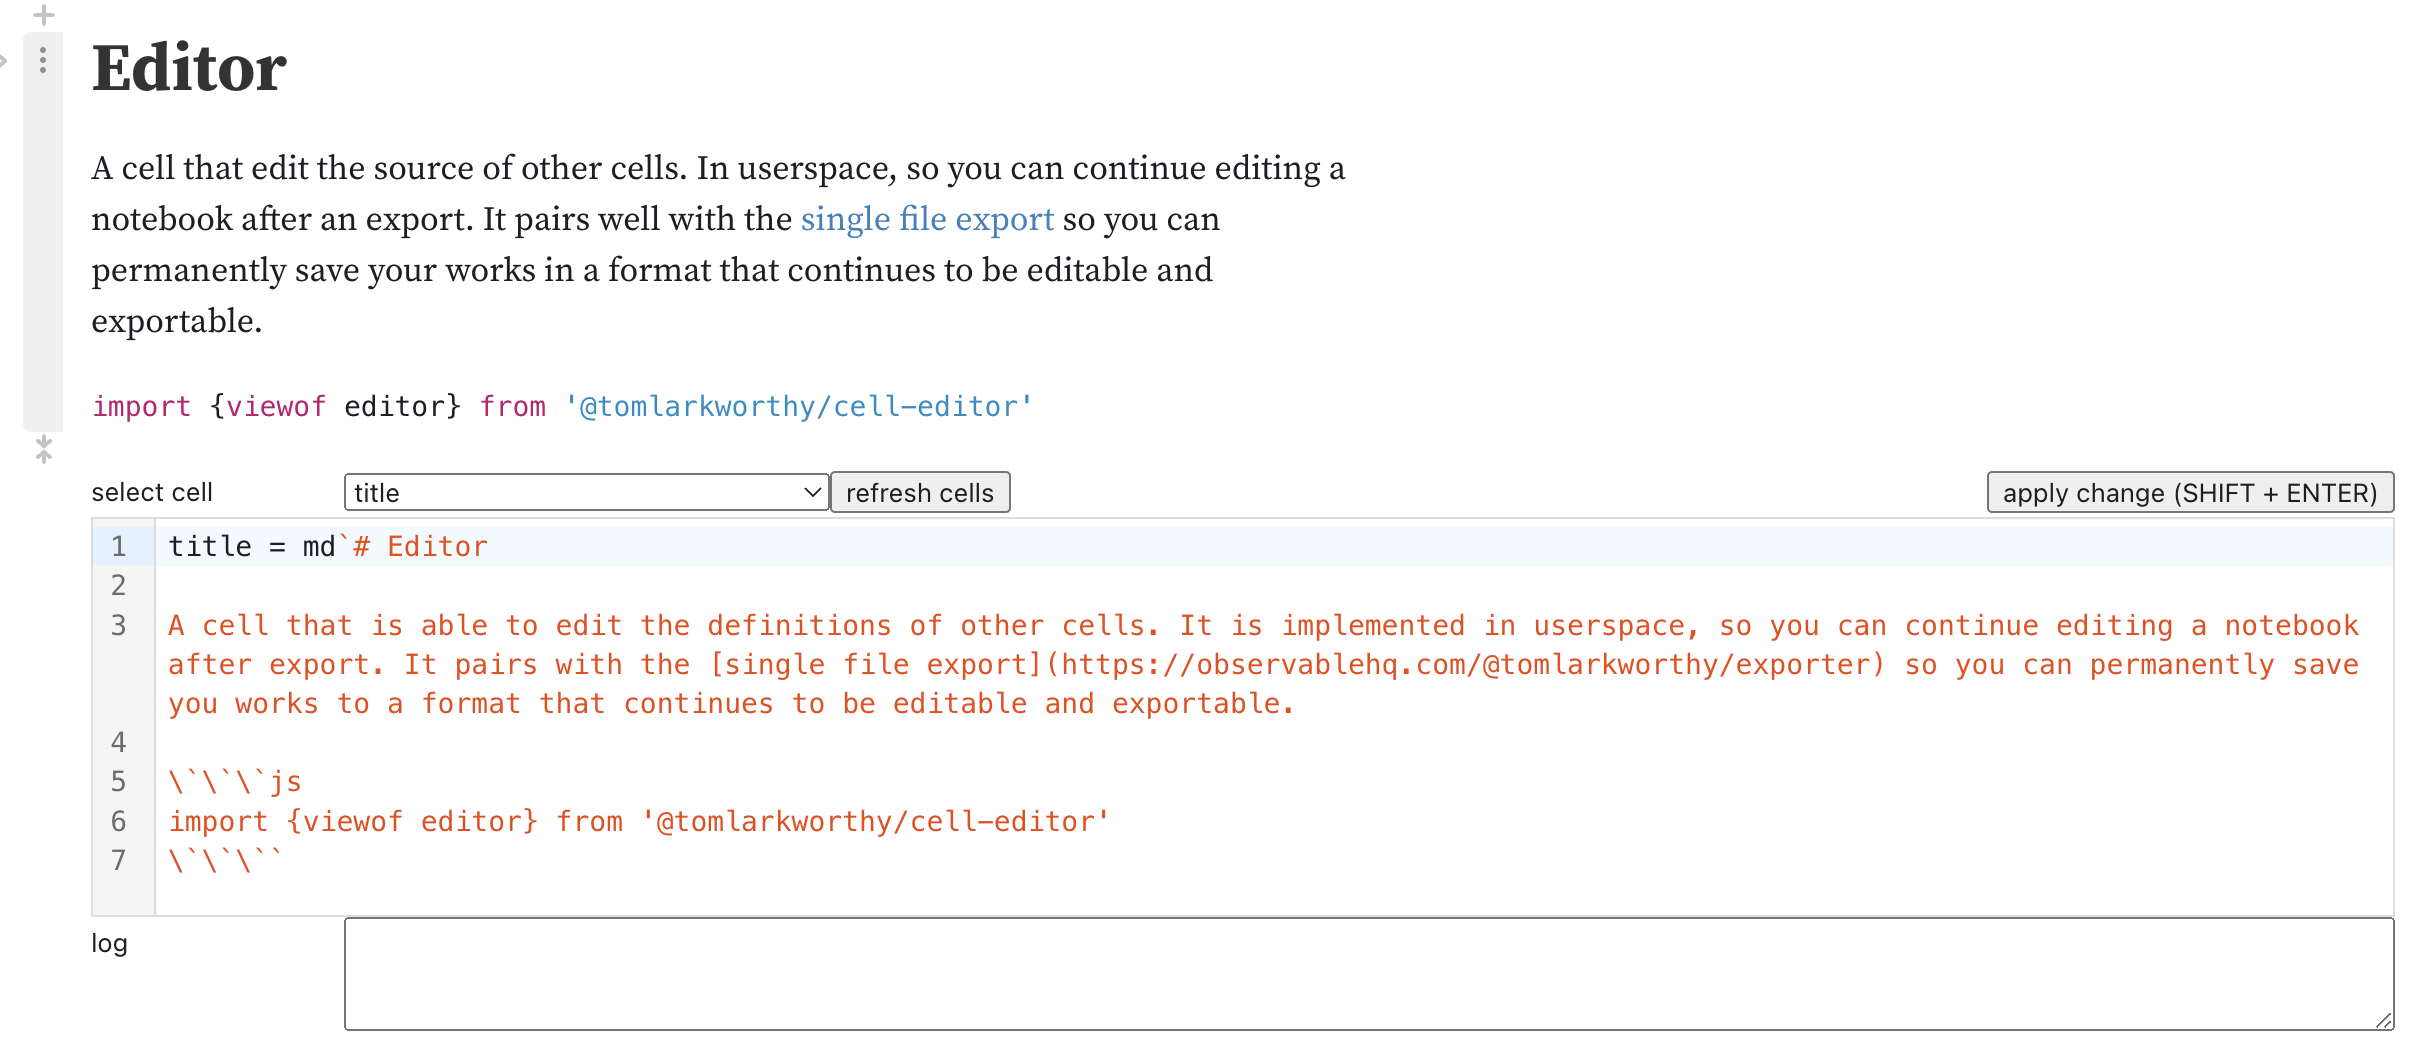
Tom Larkworthy 2024-11-27 18:38:46 So orthogonal artifact 1 of (maybe) 3 for reimplementing (a subset of) Observable in userspace is done (exporter). The next thing, as discussed in the demo, is to preserve the editing experience by adding a userspace code editor, so that the exported, unbundled (offline-first) notebook carries its own editor around with it.
Progress is pretty good. It ends up a little different to Observable as it is pinned to a specific cell, but it can also do extra things like edit the variables in dependancies which is what you want when the export format has bundled all the dependancies. You might need to change them too!
The third required project, I thought of while preparing for the demo, is the notebook renderer itself. That should also be in userspace and hackable. Even with the editor component, you can't reorder cells, as there is a whole presentation layer that lives above the runtime that chooses how to render the results. That rendering process itself needs to be hackable, so you can leave the vertical notebook format entirely. Currently the single file format follows the path of the existing observable runtime of instantiating the DOM before starting the runtime and piping observations to the DOM, but for maximum control we should let userspace be informed of the runtime changes and choose how to render. Just a shower thought at the moment but I definitely think the "renderer" should be another orthogonal component.
I am trying to document my learnings about the Observable system in some reference documentation here if you want to learn more. That documentation actually hacks the runtime so the concepts are explained adjacent to the actually executing concepts. I love literate programming.
aside: I am enjoying the single file hermetic webpage format, its like portable statically linked binary that ends up being way faster than normal webpages.

Tom Larkworthy 2024-11-27 19:50:31 500kb and gzips to 256kb which it auto does on s3 upload (I did not demo that). It prints out it's content so often I find a 1mb image in there accidentally
Tom Larkworthy 2024-11-27 19:52:43 Yeah if you look at the file attachments they are gzipped, so the notebook decompresses as part of the importmap dance
Tom Larkworthy 2024-11-27 19:53:33 The raw JavaScript in the notebook is left uncompressed for hacking, it's just the dependencies like the runtime that are compressed
Jason Morris 2024-11-29 07:09:33 I'm doing one weird stuff with knowledge graphs in my "real job", and it is sufficiently weird that I am finding that my intuitions about what's going on in the graph are dramatically incorrect, and I don't have any comprehension of how wrong I am until after I select a random collection of nodes, and visualize them somehow. The degree to which this is a pain in the ass compared to using other data structures is wild. You just cannot usefully inspect a graph in text. Are there some tricks of the trade I'm missing, here?
Jason Morris 2024-11-29 08:14:12 I haven't, but I'm tied to Python for reasons outside of my control. Do you happen to know if it deals well with Python code? I see there is a lot of WIP on that front in the repo.
Tudor Girba 2024-11-29 14:54:42 Glamorous Toolkit has support for working with Python, if that’s the question
Jason Morris 2024-11-29 15:53:15 I'm learning that VSCode has an interactive window that is supposed to let you do things like plotlib visualization in place, ala Jupyter... better than nothing, I guess?
Tudor Girba 2024-11-29 15:56:24 I am not sure why people prefer to have as comparison baseline “nothing”, but if that’s the target, I guess it’s better 🙂
Jason Morris 2024-11-29 16:04:37 Once, a man got lost driving in Ireland and stopped at the side of the road to ask directions from an elderly farmer. "How do I get to Tipperary?" he asked. Came the reply, "Sure you wouldn't want to be starting from here."
Jason Morris 2024-11-29 16:07:03 There are alternatives TO the status quo. There are no alternative stati quo. Nothing is where I'm starting. The alternatives I have considered so far include glamorous, Jupyter, VSCode's interactive window and Neo4J browser. All suggestions are welcome.
Konrad Hinsen 2024-11-29 19:35:03 I am familiar with two of your options, Glamorous Toolkit and Jupyter. GLamorous Toolkit is by far the more powerful one, in particular for developing your own views (and other personal tools). Jupyter has the main advantage of being easy to put on the Web, if that's something you need. But if you need more than the already existing widgets, you are in for some major yak shaving.
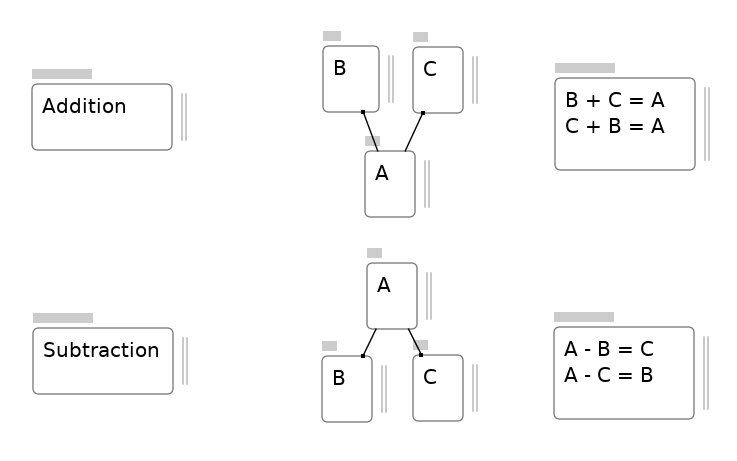
Kartik Agaram 2024-12-01 00:06:34 I've been watching my wife teach the kids second-grade math for a few weeks now with the glimmer of an idea in my head that just came out.
The tree notation for addition and subtraction shows the symmetry between them, and also the symmetry between operands.
I know it's valuable, because it got instantly adopted in lessons, where most of my ideas get gently humored and booted out of the room.
I'd never have the sense something like this was valuable before hanging out here ❤

Kartik Agaram 2024-12-01 07:40:54 It's just a picture like I might draw on paper, that's all. I'm using the trees to represent addition and subtraction by flipping them. The other boxes are just trying to explain that..
Kartik Agaram 2024-12-01 07:42:49 The top row of the tree is always provided. The bottom row has an empty box. But if there are two boxes either can be empty.
Kartik Agaram 2024-12-01 16:31:42 Oh you mean the UI around each rectangle! The top bar is for moving a box. The lines on the side are for adjusting width. (Height becomes whatever it needs to be.)
Sorry that's a lot of distraction in the picture.

