Mariano Guerra 2024-10-07 18:13:42 do you know of a good formal specification of the semantics of spreadsheet evaluation?
Alex McLean 2024-10-09 16:14:18 I've realised what dynamic media and algorave have in common - they're both 80% community development and 15% projector placement
Brian Hempel 2024-10-10 00:27:01 Is there a citation/reference or name for the idea of the gap between the power of spreadsheets and the power of general purpose programming?
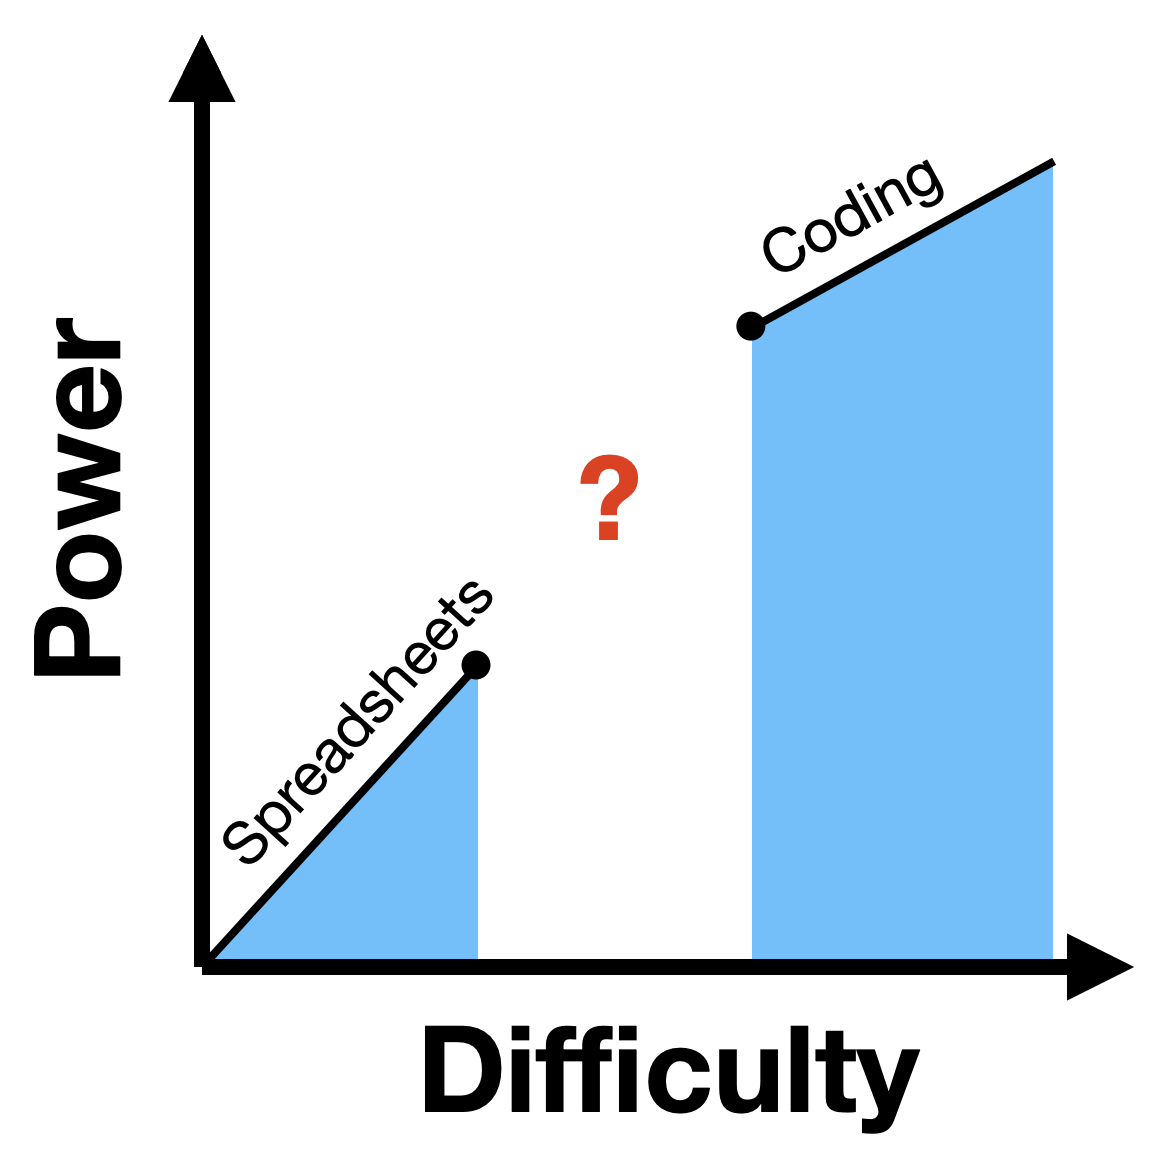
Ivan Reese 2024-10-10 00:52:24 Right off the bat: I don't have a good citation. But I will allow myself to be nerd-sniped by the graphic. Please feel free to ignore this digression.
Do you have a particular meaning of "power" in mind? Like, is it about the range of computations that can be expressed? (eg: something like Chomsky Hierarchy.) Spreadsheets can be Turing complete, after all.
Between, ASM and C++, which is more difficult and which is more powerful? What about TypeScript and JavaScript, or Agda and TCL?
Brian Hempel 2024-10-10 01:03:03 Haha, maybe Power = number of tasks that are solvable within a reasonable cognitive energy budget.
Tom Larkworthy 2024-10-10 04:23:33 I think maybe its how well it "scales" to "deep" problems. Coding can coordinate large teams on year long software projects. Spreadsheets hit a ceiling of complexity so are stuck but very efficient at solving shallow problems,
Konrad Hinsen 2024-10-10 06:26:39 "Number of tasks" is poorly defined. Tasks are not enumerable. I'd even claim that "power" is poorly defined as a property of a tool. Tom Larkworthy's depth is a much more productive criterion for classification. Another one, somewhat similar, is problem complexity.
Tom Larkworthy 2024-10-10 06:43:44 I was thinking logical depth when I said it, which is a measure of problem complexity. Code can mirror the underlying depth, but spreadsheets have a fixed number of sub-sheets so there is a limit to the recursive depth of divide-and-conquor solutions. Notebooks that can import other notebooks seem like a good middle ground and thats why I love Observable, and why it can scale!
Alex McLean 2024-10-10 07:35:43 My contribution to this debate is that spreadsheets are coding. Furthermore "general purpose programming" is a myth, perpetuated on the basis that the established way of doing things is inevitable and universal.
Stefan Lesser 2024-10-10 08:10:26 Certainly not a reference for what you’re looking for, but you just reminded me that I did a short presentation at the Recurse Center in 2017 about something very similar. Here are the slides, it’s only 6 of them.
I chose difficulty and expressiveness for the axes, and explained both briefly on slide 2. If you’re confused about the planets, so am I; I think that was part of a joke because everyone was waiting for me to declare which programming language goes where, but that would’ve obviously derailed the conversation and my point was that in the grand scheme of things their differences are just a small part of the whole design space. So I switched programming languages for something neutral.
Notably, I didn’t put spreadsheets in there. Where would they go in this?
Dan Swirsky 2024-10-10 08:32:09 I am currently “living” in the gap, tinkering with filling it by extending the spreadsheet paradigm beyond rows and columns of text, numbers, and dates. As I envision it, cells are described using text, where each cell represents a different application component, including data, GUI widgets, and even code. Groups of cells may be arranged hierarchically, such as a window-type parent cell and its child GUI widget cells. Different cell types have different attributes. Date-type cells have a value attribute that represents the date, a date format attribute, etc. GUI widget-type cells have display-type attributes. Code-type cells have code-triggering attributes (e.g., time-based, cell attribute value-based, etc.) As in a spreadsheet, cell attribute values are defined using literals or reactive formulas that may depend on other cell attribute values. As in a spreadsheet, the application “runs” when cell attribute values change and other cell attribute values are recalculated. See github.com/Danskydan/Hilltop for a brief write-up.
Duncan Cragg 2024-10-10 09:15:07 To refer back to the "gap" graphic, I think the goal would be to avoid the gap all together, by simply going near-vertically up from that dot under the "s". There are easy first steps towards that: (1) drop the grid and have attribute-value blocks (2) allow circular dependency by default between blocks
Denny Vrandečić 2024-10-10 09:29:27 funny, due to the URL it looks like it is a master thesis, not a habilitation thesis 🙂
Dan Swirsky 2024-10-10 09:49:29 Duncan Cragg, at this stage I'm concentrating on fleshing out the language, which I hope will be Turing complete. I believe that Excel allows circular references if required, so this would be an implementation issue for greater minds than mine.
Duncan Cragg 2024-10-10 10:54:06 not too hard actually, just need a fixpoint detector and iteration limit
Guyren Howe 2024-10-10 15:20:30 Although Excel is technically Turing-Complete, that’s not how folks use it. The gap is that between First Order/declarative and Higher Order/Turing Complete.
Ivan Reese 2024-10-10 16:14:29 Right—they don't use excel as a TC lang because it's too difficult . So I think each tool deserves a curve spanning from zero to infinity along the x axis, showing how much power it gives you if you're willing to tolerate that amount of difficulty.
Jari 2024-10-10 17:41:33 Another dimension to think about: spreadseets are easy to understand when the amount of data is small. But happen to your sheet when there are over one million rows. I am curretly tinkering in the gap and I experience that I am mainly writing excel-like functions which use variables. But let's make it one billion rows: my philosophical question is that why sheets stop working when the amount of data increases?
Ivan Reese 2024-10-10 17:48:38 Great point — spreadsheets are less difficult if you mostly care about the data you have, and want to work directly with that data, and the transformations are simple. But if you need complex transformations, conventional programming languages get you there, but also make you surrender the visibility of your data.
Data visibility gives you a power boost in the low end of the difficulty spectrum. Abstraction gives you a power boost in the high end.
Jari 2024-10-10 17:55:06 Yes indeed. another of my favorite tools is Jupyter Notebook. We can learn from it too by understanding that you can have visual clarity and stepwise feedback even if algorithm is really complex like ml algos
Ivan Reese 2024-10-10 17:58:31 Here's a completely uncontroversial figure. Cite as "Reese, et hell (2024)"
Konrad Hinsen 2024-10-11 06:47:53 @Jari Notebooks work for tasks that have a coarse-grained linear structure. The code in the cells usually calls library functions that are almost black-box code (even itf its Open Source, few notebook users can figure out how to see it), which is why you get only coarse-grained explanations.
Maybe more importantly, notebooks emphasize code whereas spreadsheets emphasize the input data. It would nice to be able to mix both, at the discretion of the user.
Tom Larkworthy 2024-10-11 07:06:08 Yeah I have been incredibly dissapointed at the low number of people who edit or read the code in notebooks. Makes me question whether end user programmable is that much of a useful direction overall. Sometimes I think its a UX thing, but actually I just think cognitive overhead of orientating yourself in a foreign codebase, or just not being able to read code (non-pgorammer or unfamiliar language). However, the 1% of people who do read code find it very useful. I actually think code reuse through linked notebooks is also only useful for the individual, but copy and pasting working code across notebooks between teams is more prevalent, because new contexts for code have slightly different requirements and emphasis, so its basically its better to copy and paste code and trim to the situational need than to try to build (bloated) reusable libraries.
I don't think notebooks are code-first though, they are sparse-complex values-first (list of objects/markdown), whereas spreadsheets are dense-simple values-first (matrix of scalars). You said yourself people don't read the code in notebooks.
Konrad Hinsen 2024-10-12 08:03:32 Tom Larkworthy I think a big issue with today's incarnations of Notebooks is that they don't have a clear role. I see them advertised for two very different roles, which however have conflicting requirements:
- An interactive tool for explorative programming.
- A computational document for publication.
They do a better job at 1 than at 2, largely because prominently displayed code matters for 1, whereas the reader of a computational document would prefer to understand the data-based narrative first and only then (or maybe never) look at the code for a deeper understanding.