Lu Wilson 2024-04-30 12:37:21 Leonard Pauli 2024-04-30 13:30:41 Soo cool! I've been wanting something that continuously shows me inspiration of similar things (that possibly others are working on, for connection; or not, just as suggestions); sometimes in place like this, but mostly as a range of "alternate futures". Ie. with the grid example, from just two datapoints, you could extrapolate in multiple ways! I can get frustrating when the assistants goes with something different than you intended, but visual things have the benefit of being easily distinguished at a glance! Have like five "agents" that are more stable across time, but continuously change with your changes. Each estimates its relevance, and fade accordingly, getting replaced by new fresh agent that starts off from your latest view. All five on a row, then scrolling down to see the future, ie. letting them progress even further, but really, causing a fractal tree as the future branches exponentially for every choice, but again, with less relevant branches fading into the z-distance. Tap anyone to see bigger, either just highlight elements to bring into your canvas, or fully switch into their world.
Christopher Shank 2024-05-01 00:13:21 For the last month I've been working on an arrow toolkit for the web, called Quiver 🏹. It's exploring 3 problems:
- What if visual connection could be declaratively expressed in HTML?
- What if there was a tiny toolkit that enabled all kinds of connection/arrows to be built?
- How do we break arrows out from spatial canvases and enable them to used on any website?
Currently I'm prototyping some pre-built arrows/connection: curved arrows, orthogonal edges, Xanadu links and hyperedges. But the library is also explicitly designed to be extensible so you can use your own layout algorithms or designs. Part of the extensibility means the ability to easily animate objects along the arrow (for all of those dataflow VPLs out there 😜) or add arbitrary labels/annotations to arrows.
Given that connection is probably one of the most commonly used relationships in visual programming systems, I'm curious if there are any other types of arrows or functionality you would find useful in your own projects? Its not published to NPM yet, but the repo is here.
Christopher Shank 2024-05-01 01:28:53 One of the deeper explorations is how to use these boundaries to orchestrate a bundle of arrows to reduce crossing other arrows or shapes, arrows that route with even spacing, etc. its interesting given all the arrows and their state in in the DOM
Maikel van de Lisdonk 2024-05-01 06:01:20 Really awesome! A nice addition would be data-ports on the boxes and cubic bezier curves between these ports instead of arcs. A hack to make line-crossings more clearly would be drawing double lines.. where one of the two lines would be slightly thicker and have the same color as the background (I use that trick myself).
Very nice to see the use of web-components! I believe that we finally will see a bigger use of these once react-19 is released.
Christopher Shank 2024-05-01 07:10:56 Maikel van de Lisdonk Thanks!
A nice addition would be data-ports on the boxes and cubic bezier curves between these ports instead of arcs.
Ya the "data-port" edge with a cubic bezier curve is a type of arrow I've yet to dive into, thanks for confirming!
A hack to make line-crossings more clearly would be drawing double lines.. where one of the two lines would be slightly thicker and have the same color as the background (I use that trick myself).
Do you have an example to share? would be curious to learn more!
Maikel van de Lisdonk 2024-05-01 07:31:00 It also has moving data points when you run a flow but this works via javascript 😊
Christopher Shank 2024-05-01 08:09:24 Maikel van de Lisdonk Thanks, I see what you mean! Definitely has much better contrast! (Also it looks like you're in the canvas working group, maybe we've bumped into each other there?)
Paul Tarvydas (I'm assuming you meant to respond in this thread!)
- Totally agree! A current tension in this project is that these arrows operate independently of any specific layout algorithm. You can use it with browser layout algorithms (e.g. document flow, flexbox, grid, etc.) or your own absolutely positioned layout algorithm. This is because each arrow operates independent of each other, they look at their source and target elements and use some arrow algorithm to render and arrow in between. So it currently doesn't handle collision with other elements or intersections between arrows. Good in some cases, not desirable in others... some future work I want to explore is extending this approach to orchestrated element/arrow layouts!
- Orthogonal edges are WIP (see video attached)
- Edge bundling is another area of exploration I'd love to get to. I'm starting by implementing hyperedges. Maybe a naive edge bundler converts a set of independent arrows into a hyper edge, not sure yet? I'd also love to explore how interaction could aid in "busy diagrams",,, Things like hovering over a node to highlight associated arrows. Some times I think we focus too much on layout and not enough on progressive disclosure as diagrams grow.
Paul Tarvydas 2024-05-01 09:11:21 As a data point, here's a live diagram that I'm using to generate usable code. I drew this with draw.io (which sorely needs to be better when it comes to being a code editor):
observations:
The human gets the last say, auto-layout is a great tool as long as the human gets to say "nope, I want this to be displayed here" or something like that
90-degree connection lines (rounded corners, in this case)
In some cases, too many lines make the diagram look "too busy" ("rule of 7"), in some cases it makes sense to bundle them together. In this case, I moved the boxes to where I wanted them, then painstakingly tweaked each arrow manually. In some cases, I reduced the diagram complexity by overlaying arrows on top of each other (poor man's "bundling").
Paul Tarvydas 2024-05-01 11:13:02 [yeah, I did mean to reply in this thread - I moved the above stuff out of the main backbone]
Paul Tarvydas 2024-05-01 11:13:48 In case this is helpful: "bundling" is a purely-visual thing (a macro?), whereas point-to-point connection is a semantically interesting thing [I haven't figured out what this means, since I found a kludgy workaround for my purposes when using draw.io. Yet, I sense that keeping the two concepts separated will produce new insights on how to deal with them]. [In fact, as I write this I am wondering whether the solution is to provide a way to specify visual constraints while stripping such visual detail out when boiling the info down for semantic analysis]
Elliot 2024-05-03 18:56:58 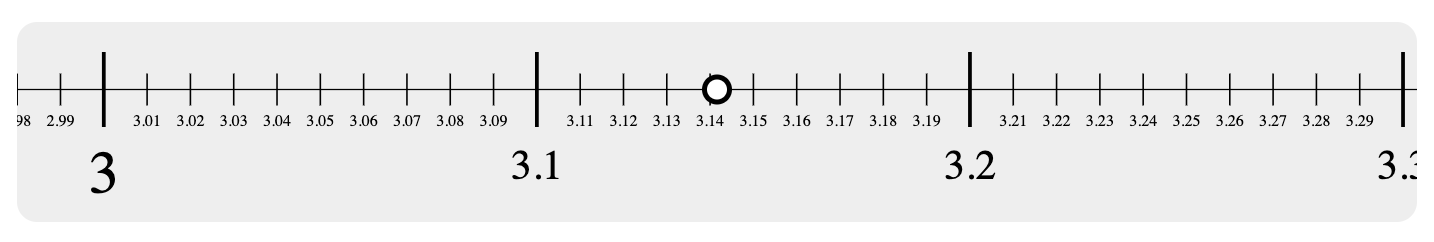
Kartik Agaram 2024-05-03 19:14:53 📝 New version after 51 days
I just published a new version with a few changes. Firstly, an incompatibility: creating an editor now requires a font, where it used to implicitly use the current font. I'm fixing one previous Devlog...
Elliot 2024-05-03 19:54:24 Wow cool. I need to look at your stuff more Kartik Agaram. I looked around a bit and thought your post about all 1d cellular automata on a canvas was especially cool.
I made a 2D equation plotter with padding, zooming, and constraint nudging here: observablehq.com/d/67402a1c3d280238
I will have to add a zooming x and y axis to it!
Joshua Horowitz 2024-05-03 20:30:15 This is great. Fun alternative: rather than showing decimal expansions, show fractions with all possible denominators up to a certain value, with that value increasing as you zoom in. (Like a en.wikipedia.org/wiki/Farey_sequence.) You might be able to see, e.g., how it’s particularly hard to find fractions near ϕ.
Elliot 2024-05-03 21:06:23 Oh beautiful Joshua Horowitz. I thought about something like this while designing what numbers to show at each zoom level, line but didn't know it has a name! Farey sequence! I love the idea of visualizing that phi is hella irrational.
Elliot 2024-05-03 21:08:56 A bit related: I also want to somehow visualize that real numbers are limits of (Cauchy) sequences of rationals. I can do an animation of infinite zoom that avoids all rational ticks, but I'd like to find a way to do it in a "projective" way i.e. without animation.
Joshua Horowitz 2024-05-03 21:13:07 Hmm if you just want to show how real numbers are limits of sequences of rationals, you could do something like highlighting the ticks that represent truncations of pi as you zoom in. But maybe I don’t get what you’re saying yet.
Arvind Thyagarajan 2024-05-03 22:08:30 this is sweet!! snap-to-smallest-visible-marker would be nice
Elliot 2024-05-03 23:29:17 Thanks @Arvind Thyagarajan! Good idea, I could add "press shift to snap" or something.
Robin Allison 2024-05-04 01:52:34 I wish I had more to say, but these are so cool! Keep up the great work!
Joshua Horowitz 2024-05-04 02:17:29 I don’t get it yet (why is that branching off when it just fits into the original number line?) but you should go for it and show me.
Konrad Hinsen 2024-05-04 05:37:22 A nice variant for numericists would be to show floating point numbers, whose density is high around zero and then decreases.
Ionuț G. Stan 2024-05-04 06:08:45 I was wondering too how this might help visualize the format for IEEE-754 floating point numbers.
Chris Knott 2024-05-04 07:23:09 The adventure game Heaven's Vault keeps a timeline of everything you do and learn in the game. It is about (space) archeology and uncovering the language of an ancient civilisation. You also uncover specific stories (a love-triangle murder etc) that happened over a few months, but 10,000yrs ago.
Chris Knott 2024-05-04 07:24:13 The timeline is therefore smoothly zoomable and understandable from a high level history view (split into eras, covering 1000s of years), right down to what your character was doing in the last few minutes
Chris Knott 2024-05-04 07:32:46 This kind of conceptual chunking is really important for building a mental map of a large amount of information.
There's something similar in Learnable Programming worrydream.com/LearnableProgramming - the bit around "The example above only loops twenty times. Is it possible to understand a loop with, say, thousands of iterations, without drowning in thousands of numbers?"
Kartik Agaram 2024-05-04 10:15:08 I'm curious what y'all think of this "slide rule from a parallel universe". Particularly from a standpoint of visual design. It consists of an optical sight for reading out data (the vertical red line in the center with a gap in the middle). Below the sight are queued up increasingly precise approximations of pi along number lines with increasing levels of zoom. As you pan downward, number lines above the sight adjust so that the value of pi in the sight is always in the center of the window.
It's a little strange that approximations below the sight never move.
Chris Knott 2024-05-04 10:47:16 Why do the approximations below not move?
I watched the video before I read the description and assumed the user was using arrow keys to adjust value (left/right) and adjust accuracy/scale (up/down)
Kartik Agaram 2024-05-04 10:53:59 Yeah I only use the y coordinate of the mouse.
The constraint is the bubbles are always centered. The bubbles are approximations of pi on each line. As we go down, lines above adjust their approximations based on lines below.
But yeah, an alternative would be to let the bubbles move left and right, and to always show the same number vertically centered in all lines.
Kartik Agaram 2024-05-04 12:08:06 Here's that alternative. As before there's no ability to pan left and right, that's all automatic based on the zoom level within the sight.
Lu Wilson 2024-05-04 23:27:08 I made a new experimental tool where you have to draw dead fish
drawdeadfish.com


