Joe Nash 2024-03-20 08:40:05
Mariano Guerra 2024-03-20 12:06:51
I collected and summarized the answers to my question about programming-adjacent games:
Playing with Code: Programming-Adjacent Games
Corrections welcome!
📝 Playing with Code: Programming-Adjacent Games
Some weeks ago I was working on some explorable explanation for binary operators and I started thinking if there was any interesting work on making programming interactive, interesting, even fun. I as
For those situations where there's a need to automatically generate a unique color for each item in a set, I've figured out a formula that yields a good distribution based on the oklch color space. The attached document has some pretty infographics.
You can also see the source code of the document in Typst. Typst is already the future of programming.
@Fredrik interesting read. For me as a colour blind person, the 50 colours are very hard to distinguish. So be aware when using them. How do other colour blinds see this?
I'm not aware of being colour blind (but everyone has to find out sometime I guess?) but I also find the colours quite similar. E.g. I perceive the runs I've marked in the screenshot below as being extremely similar, to the point that it looks like a repeating pattern to me. Marking them out with arrows shows how the colour does change, to the point that the colour at the end of my perceived "run" is somewhat different from the starting colour - maybe laying them out in this ordered fashion isn't showing them off in an ideal situation?

@Erik Stel Even with excellent color vision, 50 colors are hard to distinguish. To me the first 14 colors look especially distinct. The point is not to construct 50 clearly distinct colors, because that's an impossible task, but to make an infinite series, which happens to repeat itself after 50 colors. I justify the repetition because after 50 colors, you can't distinguish the colors anyway, even if you use a more complex algorithm that has a period of more than 50.
@Daniel Buckmaster The formula shows some patterning that is especially appearant when laying the colors out in 7 columns. The illustration has 10 columns, which is why you have to draw the diagonal arrows. Avoiding patterning is a non-goal. The colors unavoidably get similar after a while, but they are as distinct as possible, as you can see when layed out ordered in the color wheel on the next pages.
That’s a fun investigation. In case you didn’t know, coming up with schemes of colors for different items (“categorical variables”) is a well-established & difficult problem in graphic design & data visualization. See, for instance, the eleven palettes that D3 includes: d3js.org/d3-scale-chromatic/categorical.
📝 Categorical schemes | D3 by Observable
The JavaScript library for bespoke data visualization
Joshua Horowitz I wasn't aware of prior research in categorical colors. I only studied prior research in continuous color scales. It appears that the problem is considered difficult because people didn't use the oklch color space, which has only been around since 2020. It was interesting to see the color schemes in D3. Unfortunately, ten out of eleven are black box blobs with no description of how the colors were picked or what they are supposed to be good for. The eleventh one has a blog post describing how it was made, which was by having a graphical designer subjectively pick the colors using an in-house color picker.
Plotting all the D3 color schemes, it appears as if the colors were picked by throwing darts at a color picker. The only deliberate property I see is that some of them try to avoid clustering in a/b. All eleven vary widely in lightness and chroma, which is good for making the colors look more distinct, but bad if you require the colors to be consistent. My color formula seems to be the only one designed with the property that you can take an arbitrary slice of it, and all colors in the slice will be almost uniformely distributed, and add more colors at any time and maintain near uniform distribution without having to rebalance the whole set of colors.
I've attached my plots. I've added my own color scheme on the last page for comparison. Source code is available.
A tangible programming interface inspired by Andean khipu that we've been working on..
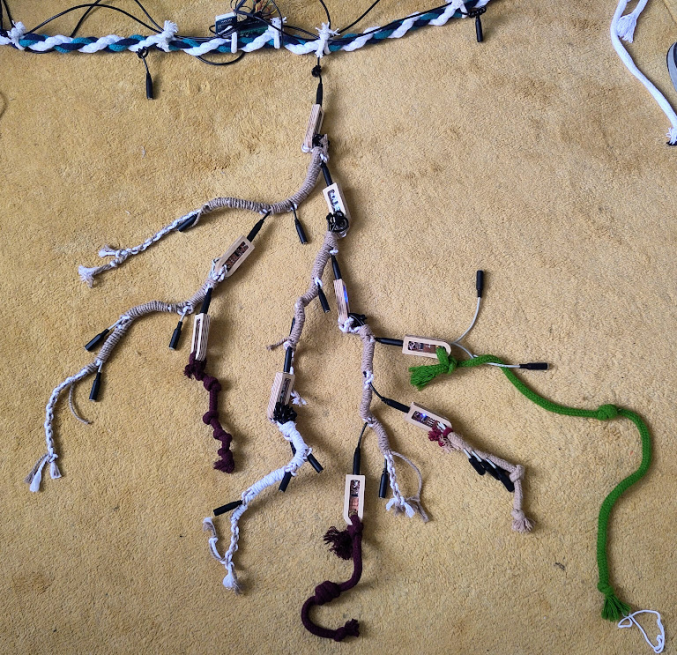
with work from last week here gitlab.com/then-try-this/khipu/-/blob/alpaca/docs/research.md
I recently thought about combining natural language prompts in code notebooks interface because it seemed like a great use case to me. While working with data, a mixture of low-level capability of writing code and a high-level capability to write transformations or visualization instructions in natural language can be a great advantage. You can code when you want to, and completely skip and offload to an LLM by writing natural language instructions! The notebook executes code and prompts in a single context. Here's something you can try that implements this idea: try-slate.com
Also wrote some thoughts in a post here and a short video demo here.
📝 Slate - A Playground for Ideas
Similar to traditional code notebooks like Jupyter Notebooks, but with a seamless integration with large-language models. Code when you want, skip when you don't. Export to code for portability.
Nice demo and writeup!
To save on prompt execution costs, Slate uses a meta-technique in case of array-like datasets to apply transformations
Could you share more about what is happening here?
Yes, sure! Essentially instead of sending the entire dataset to OpenAI APIs and asking the model to apply the prompt transformation, I send the structure of single element in the data set (the type) and ask for a function to apply over the whole dataset to make the requested transformation. The function then is applied in the browser.