You are viewing archived messages.
Go here to search the history.

Mariano Guerra 2024-02-21 09:48:14

Anyone here uses/used red-lang.org ? Could you share your thoughts on it?

David Alan Hjelle 2024-02-21 13:51:08

I think @Gregg Irwin works on it?

Francisco Garau 2024-02-21 17:26:11

I haven’t used it, but I’ve been reading about for some time — looks very interesting.

I think development slowed down a couple of years ago due to funding reasons.

Gregg Irwin 2024-02-21 18:02:41

I'm on Team Red, so yes I use it. Development has slowed, for a couple reasons, but we're still kicking. The big limitations today are pending I/O redesign, so that branch can be merged, and still being 32-bit, which means installing 32-bit libs on many Linux distros and not being able to run on new MacOS at all. Older MacOS is still fine.

Gregg Irwin 2024-02-21 18:04:53

My bias is heavy, of course, but I'm happy to answer any questions. I used Rebol before Red, and these langs make it really hard to go back to others after you get used to them. They do suffer some of The Lisp Curse, where people roll a lot of their own stuff, and there's not a full ecosystem yet. If nothing else, they stretch your mind and let you think in new ways.

Mariano Guerra 2024-02-21 18:10:36

which resources provide the best overview of the language?

Gregg Irwin 2024-02-21 18:16:02

github.com/red/docs is reference material, and covers the GUI, parse, reactivity, datatypes, and some other aspects pretty well. The best overview is still, ironically rebol.com/docs/core23/rebolcore.html Red is a direct descendant of Rebol, and that was written by its designer, Carl Sassenrath. red-by-example.org has specific examples when you need help. And there is help built into the consoles while you're actively working. We're active on Gitter, which is the best place to chat.

Gregg Irwin 2024-02-21 18:24:38

One thing that the old docs don't cover at all, because Rebol didn't have it, is the Red/System (R/S) dialect. It's a C level systems language. Red compiles to R/S, which then compiles to machine code (no external compiler needed), and R/S is, itself, a dialect of Red, so it takes the whole metacircular idea to another level. We describe Red as "A full stack language, from metal to meta". Other key aspects are that it's small, and you can build standalone programs with it. Easy to get started, as it's just a single EXE, no install required. Well, there are 3 now, because the text and GUI consoles and toolchain are separate.

Mariano Guerra 2024-02-22 11:36:31

Why are you doing your FoC project?

youtube.com/watch?v=BpJYqC4PWEw

Safta Catalin Mihai 2024-02-22 15:03:29

Does anyone know of a: 1. open source, 2. visual programming, 3. streaming ( as in recative streams), 4. statically typed project for visually building a data streaming graph and running it ?

I think this should be quite natural to do since looking at the code for Akka GraphDSL - it’s already pretty close to a visual language.

Mariano Guerra 2024-02-22 15:07:48

The closest I can think of is enso.org

📝 Enso | Get insights you can rely on. In real time.

Enso is an award-winning interactive programming language with dual visual and textual representations. It is a tool that spans the entire stack, going from high-level visualisation and communication to the nitty-gritty of backend services, all in a single language.

Joshua Horowitz 2024-02-22 20:22:13

Yeah I came here to say Enso.

Also wanted to note: I assume you meant “statically”, and it got autocorrected to “statistically”. But I really, really like the idea of a statistically-typed language! Maybe you could declare variables like (30% int, 70% string) myVar .

Mariano Guerra 2024-02-22 20:50:25

not the same but I've seen some tools that allow you to express confidence intervals and they propagate through the calculations, they even are displayed in charts, can't remember the tool

Mariano Guerra 2024-02-22 20:56:23

Found it docs.causal.app/formulas/values-with-uncertainty

Ranges and the Monte Carlo method

When variables are in the format of a range (e.g. 0 to 100, uniform(0,100), a

is run to estimate the possible outcomes of an uncertain event. Monte Carlo will randomly pick a value from the distribution and compute the whole model as if it were that random constant value. This process is repeated multiple times to generate distributions for the output variables.

The use of the simulation allows Causal to perform computations using values with uncertainty that are not possible without it. Due to this method of handling uncertainty, you may notice that the range of the cell and the value are not the numbers you inputted or would expect, but only by a trivial amount.

Safta Catalin Mihai 2024-02-22 21:14:54

yep, typo, thanks 👍 . You could have an int or string type in a statically typed lang: ‘Either[Int, String]’ 😄 , the percent can’t be static since it depends on runtime information about the distribution on data.

Lu Wilson 2024-02-22 16:25:08

I mapped out a huge list of prior art for visualised LINES of memory in coding environments.

I've annotated the LINEs in each example. Please check it out and let me know if it prompts any ideas/thoughts!

And if you know anything I could add, please send em over!

todepond.com/wikiblogarden/see-it/prior-art

image.png

Lu Wilson 2024-02-22 16:31:00

haha where did that emoji come from :see-it:

Eli Mellen 2024-02-22 16:31:50

i gotchyou

Kartik Agaram 2024-02-22 17:39:10

I don't get this, like 90% of what Lu Wilson does 😄 But I gather that's at least partly the point? ♥

Rafi Khan 2024-02-22 17:59:58

What is a LINE?

Lu Wilson 2024-02-22 18:01:36

a visualised LINE of memory

Rafi Khan 2024-02-22 21:44:34

Sorry, this is probably obvious but I don't know what a line of memory is

Rafi Khan 2024-02-22 21:44:44

Can you help me out? 🙂

Mattia Fregola 2024-02-23 00:55:08

found a few more possibly valid lines 👀

lines-6.jpg

lines-5.jpg

lines-4.jpg

lines-3.jpg

lines-2.jpg

lines-1.jpg

Prabhanshu Gupta 2024-02-23 06:24:02

Ok this might be a bit of a stretch (what IS a LINE??) but there's some overlap with how tables work (the free form ones that you can draw on a paper or a spreadsheet). Tables are basically a bunch of interleaving lines thrown together on a surface.

image.png

image.png

Prabhanshu Gupta 2024-02-23 06:26:04

Not sure if these are related (again), but here's some more LINES I've been drawing on tables recently. I posted a bit about it 💬 #thinking-together@2023-12-14T10:04:32.780Z.

image.png

image.png

Prabhanshu Gupta 2024-02-23 06:46:50

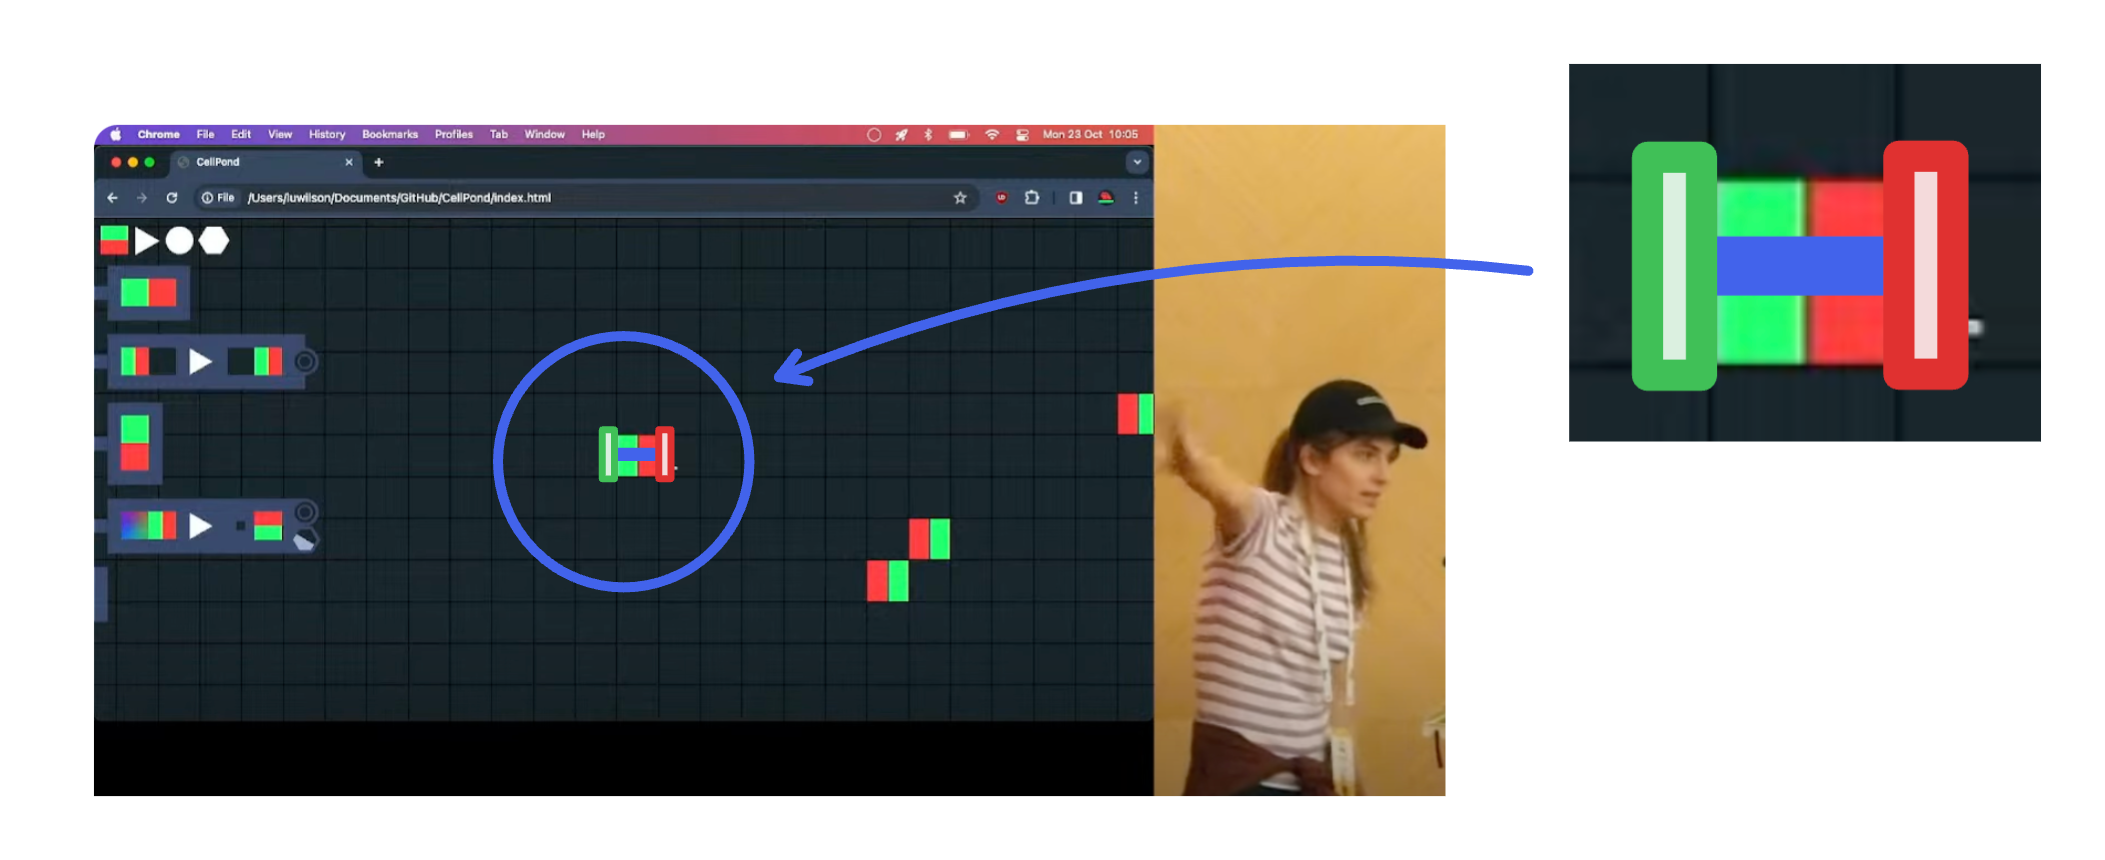
Lu Wilson This might interest you: I've found that LINES of similar width (measure by the green and red rectangle's width) always block each other – or at least they never overlap.

image.png

image.png

Prabhanshu Gupta 2024-02-23 07:54:49

oh *of similar width and direction

Lu Wilson 2024-02-23 08:09:44

@Rafi Khan sure thing :)

data is stored in our computers. it's stored in "memory" so that it can be retrieved, and edited, and moved, and manipulated, etc.

that memory is often stored in an arrangement of a "line". for example, in an array, or a stack, or a heap, a register, RAM, list, etc...

sometimes we might want to "visualise" this line of memory, so that a person can "see it". maybe to understand it better, maybe to debug a problem, maybe to learn.

so... how do we visualise it? what's the best way? I've been collecting up this list of visualised LINEs to learn about what's already been done.

Kartik Agaram this explanation might help you too!

Lu Wilson 2024-02-23 08:17:25

@Prabhanshu Gupta yes! spreadsheets visualise the line(s) really well. that's what started me on this project. programming environments that arrange memory in a GRID already visualise it really well (eg: spatial computing in cellpond), so my research question is: can we bring this strength to one-dimensional memory as well? the answer might be no and that's ok

Prabhanshu Gupta 2024-02-23 08:24:10

Yeah I think so? I've been thinking of 1D ranges as just a degenerate case of 2D tables and it all works out the same way (wrt visual LINES). I'm curious about what other kinds of 1D visualisations you're thinking. The examples you've collected seem to cover a wide variety already.

Lu Wilson 2024-02-23 08:26:30

yeah i find it interesting how there doesn't seem to be a universally agreed way of representing it visually. i don't think it's because of domain-specific differences. to me, it suggests that it hasn't been figured out yet

Prabhanshu Gupta 2024-02-23 08:30:44

In some of the examples I'm squinting and it seems like the lines would apply to any representation, not just drawing out memory (that's how I made the jump to tables).

I'm guessing since memory is sequential physically, drawing a line to talk about it would come naturally: "follow the line from left to right, that's how the memory is laid out."

Lu Wilson 2024-02-23 08:33:24

could you expand on what you mean by "apply to any representation"?

Prabhanshu Gupta 2024-02-23 08:38:47

So if you want to visualise a list of Names, putting them in a LINE makes sense because you can follow it from top to bottom. If there is some sequence applied to it (let's say alphabetical), the sequencing is inferred by which name comes up first in the LINE. On top of this, you can put a "label" at the start (at the green rectangle) to give the line a name.

This is not representing physical memory, it's some abstract list of names.

image.png

Prabhanshu Gupta 2024-02-23 08:39:27

I'm really liking how LINES sounds when I say it.

Lu Wilson 2024-02-23 08:41:00

This is not representing physical memory

i would challenge that :) it's a 'representation', not a photo, so it doesn't need to be accurate. I'm not interested in accurately depicting memory - i want to visualise it in a helpful way, even if that involves lies

Prabhanshu Gupta 2024-02-23 08:43:28

i want to visualise it in a helpful way, even if that involves lies

Haha I see. That is an interesting problem.

Prabhanshu Gupta 2024-02-23 08:43:37

it's a 'representation', not a photo

wdym? I think I might've misunderstood what you mean by representing memory.

Lu Wilson 2024-02-23 08:54:33

wdym? I think I might've misunderstood what you mean by memory.

when we're coding, we often try to imagine what the memory in our program is doing.

"ok so the array looks like this... then it changes to this.... oh wait i can see the bug"

"ok so these three variables are in the local heap with these values... and i read from this one and... oh wait I can see I'm reading from the wrong one"

"ok so the buffer for the image looks like this... and I'm getting the coordinates from the index like this... and... oh wait i can see an off-by-one error"

it's helpful to visualise the memory in our program. maybe we visualise it in our head, or on a drawing, or maybe our tooling visualises it for us.

in all of these cases, the visualised representation is a highly abstracted view of that memory, because its purpose is to be helpful to a person - to help us reason about our program.

if they were accurate portrayals of the memory in our program/computer, then they wouldn't be helpful at all. they would be completely obfuscated with strange symbols and numbers, with lots of boilerplate not intended for humans. the compiler's (or runtime's) optimisations would further disguise the behaviour of the program, and all-in-all, it would be a confusing mess. the "true-est" representation would be seeing the binary bits in pure ones and zeros (maybe), and that's clearly not helpful.

so I'm not interested in visualising an accurate depiction - i want to visualise a helpful representation

hope that explanation helps!

Prabhanshu Gupta 2024-02-23 10:23:46

That makes sense, thanks! I guess what I'm coming at is lines and tables seem like a solid starting point 😛

Kartik Agaram 2024-02-23 18:20:32

Ok, this is a lot less Dadaist than I first thought.

I'd like to suggest a new acronym: IANAL. Is Always Not A LINE. We have plenty of examples, now need some IANAL counter examples.

I think that Dali painting is a counter example, for example. Thoughts everyone?

Kartik Agaram 2024-02-23 18:23:24

The best way to visualize a LINE might not always be a line. For example, merveilles.town/@akkartik/111356122874372588 uses a few different methods, particularly time.

📝 Kartik Agaram (@akkartik@merveilles.town)

Attached: 3 images

@jack@berlin.social Thanks! I spent some time today playing with Poisson Disk Sampling (image 1), and I tried hard to avoid using any prints to the terminal, which forced me to create some nice debugging UI (image 2 and 3).

Mattia Fregola 2024-02-24 02:38:53

bit of a naughty sounding acronym perhaps Kartik Agaram :satisfied:

maybe A-LINE (using alpha privative) or N-LINE for Never a LINE?

Kartik Agaram 2024-02-24 02:58:32

The joke is it stands for I Am Not A Lawyer 🙂

Mattia Fregola 2024-02-24 03:21:27

oh! learnt something new!

Francisco Garau 2024-02-24 11:23:01

Nice presentation of the Glamorous Toolkit in the latest Vamos 2024 Conference in Bern.

vamosconf.net

vamos2024.inf.unibe.ch

youtube.com/watch?v=KsAq25yT-CU